notes
Data and Business Analytics
Instructors - Ying Xu, Douglas Rolph
The content for the finals focuses on the fundamentals of finance and accounting, which I have already been familiar with, and would not be summarised here.
Course Overview
| Component | Weightage (%) |
|---|---|
| Class attendance | 5 |
| Industrial attendance | 3 |
| Homework | 10 |
| Mid-term | 20 |
| Group project | 40 |
| Final Exam | 20% |
| Evaluation | 2% |
For industrial attendance, you need to attend three out of four talks in school.
Project Details
| Project ID | Project Description | |
|---|---|---|
| 1 | Study of Current Customers’ Profiles and Optimisation of Targeted Marketing | CarClub |
| 2 | Analysis on Fuel Efficiency and User Behaviour | CarClub |
| 3 | HR Management Dashboard | SIA |
| 4 | Short-, Medium- and Long-term Effects of Real Estate Prices from Global and Local Macroeconomic Factors | SRX |
| 5 | Population Densities Prediction Based on Aggregated Subscriber Counts Per Area | Teralytics |
| 6 | Usage Logs Analysis And Visualisation | JobTech |
| 7 | Entity Normalisation Modelling | JobTech |
| 8 | Analysis of OPS Projects | OPS |
| 9 | Text Classification using Graph Neutral Network from News Sources | Infineon |
| 10 | Building a Robust Quality Indicator for Asian Public Equities Market | AXA IM |
| 11 | Building a Robust Low Volatility Indicator for China Public Equities Market | AXA IM |
| 12 | Building a Visual Model of AXA Rosenberg Proprietary Valuation Model | AXA IM |
| 13 | Study of Current Customers’ Profiles and Optimisation of Targeted Marketing | CarClub |
| 14 | Merchandise Mix Optimisation | EY |
| 15 | Improve the Relevance of Document in Search Results | EY |
| 16 | Intelligent Matching of Standard Skills with Training Courses | EY |
| 17 | Using Quantitative Data to Support Risk Profiling of SMRT Permanent Way (PWay) | SMRT |
| 18 | Using Quantitative Data to Support Risk Profiling of SMRT Rolling Stock (RS) | SMRT |
| 19 | Operational Deliveries Data Analytics | TSH Group |
| 20 | Freshness Policy and Its Impact on Lost Sales and Wastage in Supermarkets | IDSC |
| 21 | Pricing and Replenishment of Beverage Dispensers | unk |
| 22 | Predictive Modelling for Carpark Revenue | unk |
| 23 | Maximising Revenue and Utilisation for Pay-Per-Use Facilities | unk |
| 24 | Analysis of OPS Projects | unk |
No two DDP students are assigned to the same group. The top project gets a cash prize of $5000, sponsored by Niometrics.
| Week | Task | Content |
|---|---|---|
| 1 | Groundwork | Get to know your partners and advisor; Appoint group leader, liaison with advisor and liaison with company; Sign SUTO Undertaking and NDA |
| 2 | Kickoff meeting | Attend the first meeting with the company with the advisor (with your signed NDAs); Understand the project: objective,requirement, what data to be collected, what results/solution to be delivered Arrange for next meeting in the next 2-3 weeks; |
| 3 | Project modelling | Use IDEFO (functional modelling) learned in class to model your project |
| 4-5 | Data collection and preliminary analysis | Collect data by the end of week 5; Import data into data base and visualize the data; Learn how to give effective presentation; (Note: you should have at least met the company once in week 3-5) |
| 6 | Mid-term project presentation | Introduce the problem; Show data visualization; Discuss methods and project schedule; (Note:you should have at least met the company twice before mid-term presentation) |
| 7 | Break | |
| 8-9 | Data Analysis | Analyze your data; Discuss with the company about the results as well as the assumptions |
| 10 | Result summary | Summarize your results; Design the poster and send it to the company for review |
| 11 | Poster Finalization | Finalize the poster with the company and your advisor; Learn how to prepare a project report; Submit poster for printing |
| 12 | Report and presentation preparation | |
| 13 | Oral presentations; Poster presentation | Give oral presentation to instructors; Give poster presentation to visitors; Submit written report; Submit peer evaluation form |
The first meeting with the client will be attended with your professor. Arrange kickoff meeting as soon as possible.
Project deadlines and weightage breakdown
| Component | Deadline | Grade Percentage |
|---|---|---|
| Mid-term project presentation | Oct. 24 | 5% |
| Poster (Submission for printing) | Dec. 2 (6am) | 13% |
| Final Presentation | Dec. 12 | 5% |
| Executive Summary | Dec. 16 | 3% |
| Written Report excl ExSum | Dec. 16 | 12% |
| Peer Evaluation | Dec. 18 | 2% |
| Total | 40% |
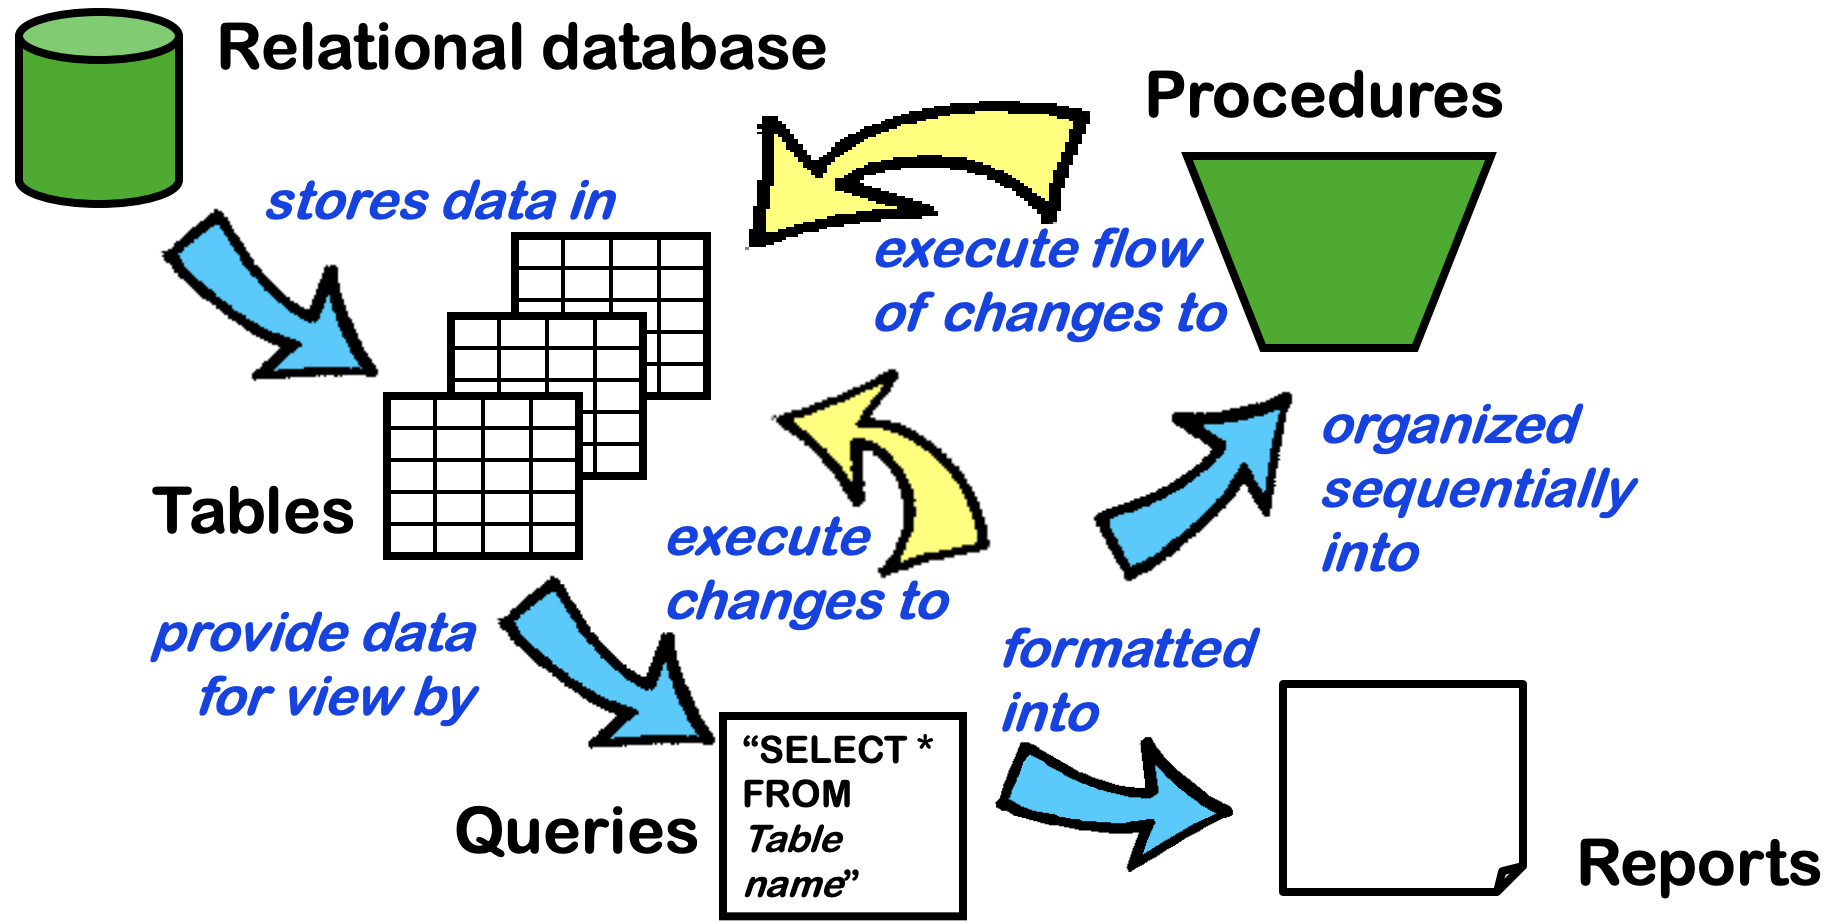
Structured Query Language (20m)
The following should require no explaination.
  SELECT *
    FROM Invoice
   WHERE BillingCity = 'London'
ORDER BY Total DESC
   LIMIT 2
One table only
When you are interested in total amount of bills from each city.
  SELECT BillingCity, SUM(Total) AS CityTotal
    FROM Invoice
GROUP BY BillingCity
Use of CASE WHEN ... THEN ... ELSE ... END
SELECT InvoiceId,
       CustomerId,
       InvoiceDate,
       Total,
       CASE WHEN Total >= 10 THEN "High"
            WHEN Total >= 5 THEN "Medium"
            ELSE "Low"
            END AS RevenueClass
  FROM Invoice
Use of DATETIME. CURRENT_TIMESTAMP is current time.
  SELECT InvoiceId, CustomerId, InvoiceDate from Q030HighRevenue
   WHERE InvoiceDate >= DATETIME("2013-01-01 00:00:00")
ORDER BY InvoiceDate DESC
Use of IFNULL. The column ‘CompanyNew’ contains is the column ‘Company’ but the missing values replaced with ‘Missing Name’.
SELECT *,
       IFNULL(Company, "Missing Name") AS CompanyNew
  FROM Customer
Multiple tables
This filters all the combination that fulfils the where condition. (This may be inefficient?)
SELECT *
  FROM Album,
       Artist
 WHERE Album.ArtistId = Artist.ArtistId
INNER JOIN is used together with ON to merge tables. Entries in ‘Album’ with null values in ArtistId is excluded.
SELECT *
  FROM Album
       INNER JOIN
       Artist ON Album.ArtistId = Artist.ArtistId
There are two types of join INNER JOIN and LEFT JOIN.
RIGHT JOIN and FULL OUTER JOIN not supported.
Try to understand the following queries.
Which employee serves the most number of customers?
  SELECT ee.FirstName,
         ee.LastName,
         COUNT(cs.CustomerId) AS CustomerNo
    FROM Employee as ee
         INNER JOIN
         Customer as cs
      ON ee.EmployeeId = cs.SupportRepId
GROUP BY ee.EmployeeId
ORDER BY CustomerNo DESC
Which artist has the greatest sales?
SELECT Artist.Name,
       SUM(InvoiceLine.UnitPrice * InvoiceLine.Quantity) AS ArtistSales
  FROM (
           (
               InvoiceLine
               INNER JOIN
               Track ON InvoiceLine.TrackId = Track.TrackId
           )
           INNER JOIN
           Album
        ON Track.AlbumId = Album.AlbumId
       )
       INNER JOIN
       Artist
    ON Album.ArtistId = Artist.ArtistId
 GROUP BY Artist.Name
 ORDER BY ArtistSales DESC;
Common errors
- Forgetting a comma in the middle of an array.
- Please create a new table first, if you want to modify data.
Regression with R (10-20m)
| Method | Linear Regression |
|---|---|
| Target | Number |
| Predicts | Number |
| Model | \(y_i = \beta_0 + \beta_1 x_1 + \beta_2 x_2 + ... + \epsilon_i\) |
| Loss | Mean square error |
| Quality of fit | R-square Adjusted R-square AIC |
| Comments | Choose only the statistically significant variables This cannot predict binary objectives |
| Method | Logistic Regression |
|---|---|
| Target | Binary |
| Predicts | Probability |
| Model | \(P(y_i = 1) = \dfrac{1}{1+e^{-(\beta_0 + \beta_1 x_1 + \beta_2 x_2 + ...+ \epsilon_i )}}\) |
| Loss | \(LL(\beta) \\ = \displaystyle \sum_{i=1}^n \sum_{k=1}^2 y_{ik} \log \left( P(y_{ik} = 1) \right)\\= \displaystyle \sum_{i=1}^n \sum_{k=1}^2 y_{ik} \log \left( \dfrac{e^{\beta' x_{ik}}} {\sum_{l=1}^k e^{\beta' x_{il}}} \right)\) |
| Quality of fit | \(AIC = -2LL(\hat{\beta}) + 2(p+1)\) Confusion matrix AUC-ROC |
| Comment |
Time series analysis (15m)
Moving average
Pretty obvious, just take the average of last $n$ elements.
Exponential Smoothing (Holt 1) with $\alpha = 0.2$
| Calculations | Forecast | Actual | Error |
|---|---|---|---|
| (based on previous row) | - | 600 | - |
| $600$ | 600 | 580 | 20 |
| $(1-\alpha) \cdot 600 + \alpha \cdot 580$ | 596 | 620 | -24 |
| $(1-\alpha) \cdot 596 + \alpha \cdot 620$ | 600.8 | 590 | 10.8 |
| $(1-\alpha) \cdot 600.8 + \alpha \cdot 590$ | 598.64 | 610 | -11.36 |
| $(1-\alpha) \cdot 598.64 + \alpha \cdot 610$ | 600.912 | 570 | 30.912 |
| $F$ | $A$ | ||
| $(1-\alpha) F + \alpha X$ |
Double Exponential Smoothing (Holt 2) with $\alpha=0.2$ and $\beta = 0.1$
| A | B | Forecast $\hat{x}_n$ | Actual $x_n$ |
|---|---|---|---|
| - | - | - | 700 |
| 700 | 50 (asmp, default 0) | 750 | 760 |
| $(1-\alpha) \cdot 750 \+ \alpha \cdot 760$ | $(1-\beta) \cdot 50 \+ \beta \cdot (a_n - a_{n-1})$ | 802.2 | 800 |
| $A_2$ | $B_2$ | $F$ | $X$ |
| $A_3 = (1-\alpha) F \ \qquad + \alpha X$ | $B_3 = (1-\beta)B_2 \ \qquad +\beta(A_2-A_3)$ | $A_3 + B_3$ | - |
# Holt 1
plot(HoltWinters(AirPassengers, gamma=FALSE, beta=FALSE))
# Holt 2
plot(HoltWinters(AirPassengers, gamma=FALSE, beta=TRUE))
Process Analysis (10-20m)
Performance measures
Throughput
- Output rate of a process or a stage of a process
- Example: average number of patients served per day = 60
Flow time
- Average time spent in system by unit single output
- Often includes waiting time.
- Example: average time spent in clinic = 2 days
Work-in-process (WIP)
- Average number of units in systems over a time interval.
- Example: average number of patients in a clinic over time = 120
Little’s Law Work-in-process = Throughput * Flow Time
Calculation of throughput
| Process | Calculation |
|---|---|
| Single-stage | Throughput = Output / Time |
| Multi-stage (simple) | The lowest throughput among all the stages. |
| Stage with Parallel Activities | The overall throughput is the minimum throughput among all the parallel activities. (i.e. you need to wait for the slowest person to complete his/her part). |
| Stage with Multiple Paths | The overall throughput is the harmonic weighted sum. \(1\left/\Sigma_i^m{\frac{p_i}{Th_i}}\right.\) |
Throughout analysis
The bottleneck is the process stage with the lowest throughput rate.
- Downstream operations will be starved
- Upstream operations will be blocked
Consequence of bottleneck
It slows down the whole process, limits the process capacity, leads to low utilization at other stages, leads to job waiting, requires extra inventory/buffer/stock to place waiting jobs
Parallel Coordinates (10-15m)
Standard operating procedures
- “high Y is associated with high/low X1, X2, X3”
- “low Y is associated with low/high X1, X2, X3”
- “the converse is not true: low Y have both high and low X2”
- “with the exception of the first year of the study…”
Common talking points
- answer the question “with a focus on understanding what may cause enrollments to increase”
- causation is not correlation
- consider causation in the other direction
- “the fact that many of the variables are correlated with time makes drawing conclusions difficult” - inflation, income growth
- irrelevant factors should be ignored
- “the data are consistent with many different theories”
- sometimes two variables when combined provides a strong outcome
GIS (0-5m)
Geographical decisions - point, line, area/polygon. Polygon layer should be at the bottom, so that it will not cover the line or point layer.
X is longitude, Y is latitude
Layers and Features
- A feature is described by a geometry (point, line segment, polygon)
- Geometries are described using latitude and longitude
- Each feature is referenced by a unique index, the ‘feature id’
- Each feature has a row in a database table, indexed by the feature id
- The fields (columns) of the table are called attributes
- A layer is a collection of features with the same geometry type (point, line, or polygon)
- Every feature on a layer has the same set of attributes
Miscellaneous
Correlation
Pearson’s Correlation Coefficient \(r = \frac{ \sum_{i=1}^n (x_i-\bar{x})(y_i-\bar{y}) }{ \sqrt{\sum_{i=1}^n (x_i-\bar{x})^2} \sqrt{\sum_{i=1}^n (y_i-\bar{y})^2} } \qquad -1 \leq r \leq 1\)
Decision Tree
Which tree to select - one that classifies at least one category perfectly.
credit_data <- read.csv("wk6a-credit.csv")
plot(creditdata[,c(5,9:14)])  # scatterplot matrix
library(tree)
tree.credit = tree(Status~., data = credit_data)
plot(tree.credit); text(tree.credit, pretty=0);